If you’re looking for a powerful, open-source tool to monitor websites, services, or devices on your network, Uptime Kuma is a brilliant solution. It’s completely free and ideal for both home and small business setups. In this article, we’ll guide you step-by-step on how to set up Uptime Kuma using Docker on a Linux machine, configure monitors, and begin tracking uptime and availability.
What is Uptime Kuma?
Uptime Kuma is a self-hosted monitoring tool, similar to services like Uptime Robot. It lets you track the status of your websites, devices, and services through a beautiful, customizable dashboard. With features like interval checks, certificate expiry monitoring, and ping-based uptime checks, it’s one of the most user-friendly and efficient network monitoring solutions available today.
Step 1: Install Docker and Docker Compose
Start by logging into your Linux machine. You’ll first need to install Docker, the containerization platform required to run Uptime Kuma.
Run the following command to install Docker:
sudo apt install docker.io -y
Once Docker is installed, you’ll also need Docker Compose. This allows you to define and manage multi-container Docker applications, even though Uptime Kuma only needs one.
Install Docker Compose with:
sudo apt install docker-compose
This process may take a few minutes to complete.
Step 2: Set Up Uptime Kuma Directory and Compose File
Now that Docker is ready, create a directory for Uptime Kuma:
mkdir uptime-kuma
cd uptime-kuma
Inside this directory, create a docker-compose.yml file using the Nano text editor:
nano docker-compose.yml
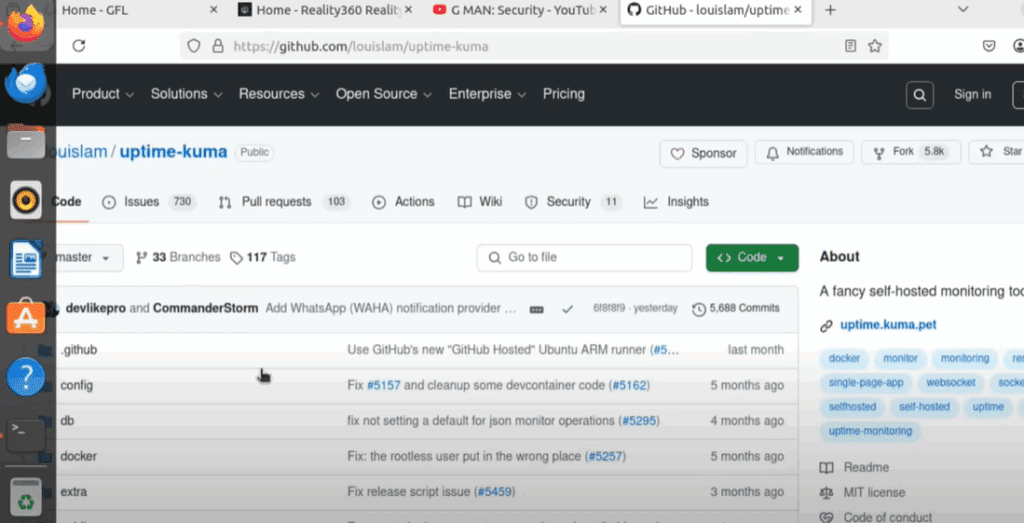
Paste the following content into the file (you can also find this on the Uptime Kuma GitHub page):
version: '3.3'
services:
  uptime-kuma:
    image: louislam/uptime-kuma
    container_name: uptime-kuma
    restart: always
    ports:
      - "3001:3001"
    volumes:
      - uptime-kuma:/app/data
volumes:
  uptime-kuma:
Save the file and exit Nano by pressing Ctrl + X, then Y, and then Enter.


Step 3: Launch Uptime Kuma with Docker Compose
To start the Uptime Kuma service in detached mode, run:
sudo docker-compose up -d
Docker will begin downloading and setting up the necessary components. Once this is complete, the Uptime Kuma service will be running in the background.
Step 4: Access Uptime Kuma Web Interface
To begin monitoring, open your web browser and go to:
http://<your-linux-ip>:3001
Replace <your-linux-ip> with the actual IP address of your Linux machine.
You’ll be prompted to create a new Uptime Kuma account. Enter a username, password, and confirm your credentials. After clicking Create, you’ll be taken directly to the main dashboard.
Optional but recommended: switch to Dark Mode from the settings—because everyone loves dark mode!
Step 5: Discover Devices on Your Network
To begin monitoring devices, you need to identify them first. One way to quickly scan your network is by using Nmap:
nmap -sL <network-range>
For example:
nmap -sL 192.168.1.0/24
This provides a list of devices on your network, along with their IP addresses.
Step 6: Add Monitors in Uptime Kuma
Now go back to the Uptime Kuma dashboard and click the “Add New Monitor” button.
Example 1: Website Monitoring
- Monitor Type: HTTP(s)
- Friendly Name: My Website
- URL:
https://yourwebsite.com - Heartbeat Interval: 30 seconds
- Check Certificate: Enabled
Click Save, and your site will now be monitored. You’ll see a graphical display of response time, status, and certificate expiry details.
Example 2: Device Monitoring (e.g., Router)
- Monitor Type: Ping
- Friendly Name: Office Router
- Hostname:
192.168.1.1(Replace with your device IP) - Heartbeat Interval: 20 seconds
Click Save, and Uptime Kuma will now start pinging your router at the specified interval to check uptime.
Step 7: Use the Dashboard for Centralized Monitoring
Click the Dashboard button in the top right corner to see a consolidated view of all devices and services you’re monitoring. You’ll find up/down status indicators, response metrics, and alerts—all in one place.
As you add more devices (e.g., smart plugs, NAS, printers, PCs), the dashboard becomes an incredibly useful tool for managing your entire network at a glance.
Conclusion
With Uptime Kuma, you can build your own professional-grade network monitoring dashboard—entirely for free. It’s open-source, customizable, and surprisingly easy to deploy using Docker. Whether you’re a tech-savvy home user or managing a small office network, Uptime Kuma is a must-have tool.
Take control of your network visibility today and make sure your services are always up and running.
Tags: uptime kuma, docker, linux, network monitoring, self-hosted monitoring, docker compose, website uptime, home server, network devices, linux tools, ping monitoring, open source monitoring, docker tutorial
Hashtags: #UptimeKuma #Docker #NetworkMonitoring #LinuxTools #OpenSource #SelfHosted #DockerCompose #WebsiteMonitoring #SysAdmin #HomeNetwork