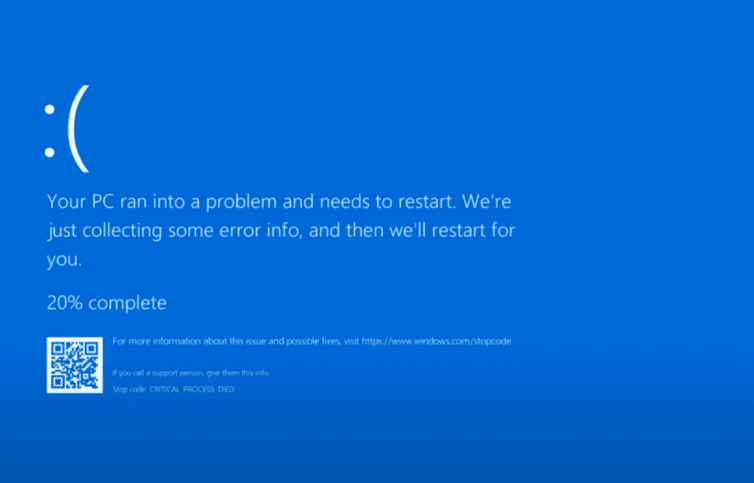
If your PC is suffering from the Blue Screen of Death (BSOD) or constant crashes, this guide will help you troubleshoot and fix common issues causing these errors. The Blue Screen of Death occurs when Windows encounters a critical error and forces a shutdown to prevent damage. Below, we’ll explore how to analyze crash dump files and identify the root cause of the problem.
Step 1: Configure System Failure Settings
Before analyzing crash logs, ensure your system is set up to generate memory dump files when a crash occurs.
- Open System Properties:
- Press Win + X and select System.
- Scroll down and click About.
- Under Related settings, click Advanced system settings.
- Adjust Startup and Recovery Settings:
- Under the Advanced tab, click Settings in the Startup and Recovery section.
- Ensure Write debugging information is set to Small memory dump (256 KB) or Kernel memory dump for more detailed logs.
- Uncheck Automatically restart to prevent the system from rebooting immediately, allowing you to read the error message.
- Uncheck Overwrite any existing file to preserve previous dump files for analysis.
- Click OK and restart if prompted.
Step 2: Locate Memory Dump Files
Crash logs are stored in the Minidump folder:
- Open File Explorer and navigate to:
C:\Windows\Minidump- If the folder is empty, your PC hasn’t crashed yet or dump files are not being saved.
Step 3: Analyze Dump Files Using WinDbg (Windows Debugger)
Microsoft provides WinDbg, a free debugging tool to analyze crash logs.
Install WinDbg:
- Download the latest version from Microsoft’s official site.
- Avoid the Microsoft Store version, as it may be outdated.
- Install and launch WinDbg.
Analyze a Dump File:
- Click File > Start Debugging > Open Dump File.
- Browse to the Minidump folder and select a dump file (e.g.,
MEMORY.DMP). - Let WinDbg load the necessary debugging symbols.
- Once loaded, type
!analyze -vin the command bar and press Enter. - Review the analysis, focusing on:
- Image Name (the faulty driver or process).
- Bug Check Code (e.g.,
PAGE_FAULT_IN_NONPAGED_AREA). - Stack Text (shows where the crash occurred).
This data helps identify problematic drivers or hardware issues.
Step 4: Use Third-Party Tools for Easier Analysis
If WinDbg seems complex, try these free alternatives:
1. WhoCrashed
- Download WhoCrashed
- Analyzes dump files and suggests possible causes.
- Free version provides basic diagnostics.
2. BlueScreenView (by NirSoft)
- Download BlueScreenView
- Displays driver-related crash details in a simple interface.
Step 5: Troubleshooting Based on Findings
Once you identify the culprit:
- Driver Issues: Update or roll back drivers (especially GPU, chipset, or storage drivers).
- Hardware Issues: Test RAM (using Windows Memory Diagnostic) or check disk health (
chkdsk /f). - Software Conflicts: Perform a clean boot to isolate problematic applications.
- Windows Corruption: Run
sfc /scannowandDISM /Online /Cleanup-Image /RestoreHealth.
Final Tip: Fresh Windows Install (Last Resort)
If crashes persist:
- Install Windows on a separate drive to test if the issue is software-related.
- If crashes stop, the problem was likely a corrupt driver or OS issue.
- If crashes continue, suspect hardware failure (RAM, SSD, GPU, etc.).
Conclusion
By analyzing memory dump files with WinDbg, WhoCrashed, or BlueScreenView, you can diagnose BSOD errors effectively. Always note the error code and circumstances before the crash for better troubleshooting.
Tags:
Windows repair, Blue Screen of Death, BSOD fix, PC troubleshooting, WinDbg, WhoCrashed, BlueScreenView
Hashtags:
#WindowsRepair #BSOD #PCTroubleshooting #WinDbg #BlueScreenFix #TechTips


Disclaimer: This guide is for informational purposes only. Always back up your data before making system changes. Some third-party tools may require paid versions for advanced features.