When your computer starts to feel sluggish or programs behave oddly, the first instinct is usually to open Task Manager. Task Manager has come a long way in Windows 10 and Windows 11, but sometimes it simply doesn’t give you the depth of detail you need to truly understand what’s happening under the hood.
That’s where Process Explorer comes in. Part of Microsoft’s free Sysinternals Suite, Process Explorer is a tool every Windows user—whether a casual tinkerer or a professional troubleshooter—should know about. It offers a level of transparency into system processes, memory, CPU usage, and resource consumption that Task Manager just can’t match.
In this article, we’ll explore what Process Explorer is, why it’s useful, how to install it, and how to use it step by step. Along the way, we’ll look at practical scenarios, deep-dive features, and even answer some common questions.
1️⃣ What is Process Explorer?
Process Explorer is a free advanced system monitoring tool created by Mark Russinovich and Bryce Cogswell. It is now owned and distributed by Microsoft as part of the Sysinternals Suite.
In simple terms, it’s a supercharged Task Manager. It shows you:
- Every process running on your PC
- Which parent process launched which child process
- Detailed CPU and memory usage per process
- Handles, DLLs, threads, and environment variables
- File usage, I/O activity, and even network details
Think of it as a microscope for Windows processes. Where Task Manager shows you a big picture, Process Explorer lets you zoom into every corner of your system’s activity.
👉 Official Microsoft page: Process Explorer – Microsoft Sysinternals
2️⃣ Why Use Process Explorer Instead of Task Manager?
Task Manager is perfectly fine for most casual users. But it has limitations. For example:
- Task Manager shows you processes, but not the detailed relationships between them. Process Explorer can show a hierarchical tree view, revealing parent-child process structures.
- Task Manager has limited details on memory. Process Explorer distinguishes between Working Set (RAM currently in use) and Private Bytes (total memory committed, including swapped-out pages).
- Task Manager can’t show DLL usage or which process has locked a file. Process Explorer can pinpoint exactly which process is preventing you from deleting or moving a file.
- Task Manager shows general graphs, while Process Explorer gives you deep historical monitoring of CPU, memory, I/O, and GPU usage.
So, while Task Manager is good, Process Explorer is essential when you want more control or need to troubleshoot advanced issues.
3️⃣ How to Download and Install Process Explorer
Let’s move to the installation part. It’s quick and safe since this is an official Microsoft tool.
- Go to the official Microsoft Sysinternals Process Explorer page.
- Download the ZIP file.
- Extract it into a folder (for example,
C:\Tools\ProcessExplorer). - Double-click
procexp.exe(orprocexp64.exeif you’re on 64-bit Windows).
That’s it—no heavy installer, no unnecessary extras. Process Explorer runs as a portable program, meaning you can carry it on a USB stick.


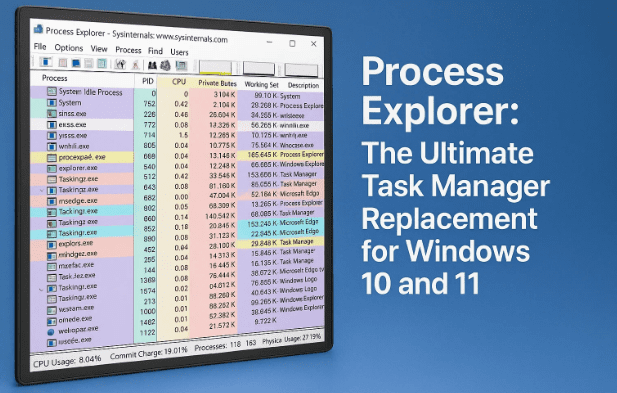
4️⃣ Getting Started: The Main Interface
When you launch Process Explorer, the first thing you’ll see is a long list of processes.
At first glance, it looks overwhelming, but once you get familiar, it becomes an intuitive control panel for your PC’s inner workings.
- Columns: By default, you’ll see process name, CPU usage, private bytes, working set, and more.
- Colors: Different colors highlight different process types (e.g., system processes, services, apps).
- Update Rate: By default, Process Explorer refreshes every second, giving you real-time data.
5️⃣ Exploring Processes in Hierarchical View
One of Process Explorer’s most powerful features is its hierarchical view.
- Parent processes are shown at the leftmost level.
- Child processes (launched by the parent) are indented below.
For example:
explorer.exemay launchOneDrive.exeorMicrosoftEdge.exe.- Each
MicrosoftEdge.exeprocess may launch multiple sub-processes.
This view helps you understand which process is responsible for others. It’s invaluable when tracking down issues like unwanted background processes.
⚖️ Task Manager vs. Process Explorer: Side-by-Side Comparison
| Feature / Capability | Task Manager (Windows 10/11) | Process Explorer (Sysinternals) |
|---|---|---|
| Ease of Use | Simple, beginner-friendly | Advanced, detailed (may overwhelm beginners) |
| Installation | Built-in with Windows | Free download from Microsoft Sysinternals |
| Process View | Flat list or basic grouping | Full hierarchical tree (parent-child structure) |
| CPU Monitoring | Shows current usage per process | Real-time usage + history graphs + per-thread |
| Memory Monitoring | Shows memory usage per app | Working Set vs. Private Bytes (RAM vs. virtual) |
| File Locks (Who’s Using a File) | ❌ Not available | ✅ Yes, find which process is locking a file |
| DLL & Handle Search | ❌ Not available | ✅ Search by DLL, handle, or file name |
| Process Properties | Limited details (path, basic usage) | Deep details: path, command line, environment, security, threads, TCP/IP |
| System-Wide Graphs | Basic CPU, memory, and disk graphs | Detailed historical graphs (CPU, memory, I/O, GPU) |
| Portable | ❌ No | ✅ Yes (runs without installation) |
| Who Should Use It | Everyday users | Power users, IT admins, developers, troubleshooters |
6️⃣ Sorting and Filtering Processes
Sometimes the list is too long, and you need a clear view. Luckily, sorting is easy.
- Click CPU column → Sort by CPU usage (highest on top).
- Click Working Set column → Sort by RAM usage.
- Click Process column → Sort alphabetically.
This simple action helps you quickly answer questions like:
- Which app is eating my CPU?
- Why is my memory usage so high?
7️⃣ Monitoring CPU and Memory Usage
When your system slows down, CPU and memory are usually the first suspects.
- CPU Column: Shows the percentage of CPU time each process consumes.
- System Idle Process: High values here are good—it means your CPU isn’t overloaded.
- Working Set (Memory in RAM): Real-time RAM consumption.
- Private Bytes: Includes RAM + swapped-out memory.
👉 A practical example: If Chrome seems slow, you can use Process Explorer to see how many Chrome processes are running and exactly how much RAM each one uses.
8️⃣ Digging Deeper: Process Properties
Sometimes you need more than surface-level info. Right-click on any process → select Properties.
Here’s what you’ll find:
- Image: Path of the executable, command line arguments, user account running it.
- Performance: Real-time graphs of CPU, memory, and I/O usage.
- Threads: Detailed breakdown of threads within the process.
- TCP/IP: Any active network connections.
- Security: Permissions and access rights.
- Environment: Environment variables seen by that process.
This is especially useful for diagnosing unknown or suspicious processes.
9️⃣ Finding Handles and DLLs
This is where Process Explorer truly shines over Task Manager.
- Find → Find Handle or DLL lets you search for a file, DLL, or keyword.
- This helps answer questions like:
- Which program has locked this file so I can’t delete it?
- Which process is using a particular DLL?
Example: If you can’t delete a Word document because “it’s in use,” Process Explorer will tell you exactly which process is holding it open.
🔟 System-Wide Monitoring with Graphs
Press Ctrl + I to open the System Information window.
Here you’ll see historical graphs of:
- CPU Usage (with per-core breakdown if you have multiple cores)
- Memory Commit and Working Set
- I/O Activity (disk and sometimes network)
- GPU Usage
Hovering over graphs even shows which process spiked at that time. This is a lifesaver when your system slows down briefly, and you want to know what caused it.
1️⃣1️⃣ Practical Use Cases
Process Explorer isn’t just for geeks. Here are real-world uses:
- Troubleshooting Slow PCs → Identify apps hogging CPU or memory.
- Diagnosing File Locks → Find out why you can’t delete a file.
- Checking Malware → Suspicious unknown process? Right-click → Check its path.
- Network Investigation → See if a process is connecting to the internet.
- System Optimization → Learn which background apps are unnecessary.
🔍 1️⃣2️⃣ FAQs
Q1. Is Process Explorer free?
👉 Yes. It’s part of Microsoft’s Sysinternals Suite and is completely free to use.
Q2. Can it replace Task Manager entirely?
👉 For advanced users, yes. But casual users may still prefer Task Manager for simplicity.
Q3. Does it require installation?
👉 No. It’s a portable tool. Just download and run it.
Q4. Is it safe?
👉 100% safe, as long as you download it from Microsoft’s official page.
Q5. Will it slow down my system?
👉 No. It uses minimal resources, even when monitoring constantly.
⚠️ Disclaimer
Process Explorer is designed for advanced system monitoring. While it is safe, do not kill processes blindly—many are essential for Windows. Terminating the wrong process can cause crashes or instability. Use it primarily for monitoring and investigation unless you know exactly what a process does.
📑 Tags
process explorer windows, sysinternals suite, task manager alternative, microsoft process explorer guide, windows process monitoring, troubleshoot cpu usage windows, memory usage windows tools, find locked files windows, process explorer tutorial, windows performance optimization
📢 Hashtags
#Windows11 #Windows10 #ProcessExplorer #Sysinternals #TaskManager #MicrosoftTools #PCOptimization #Troubleshooting #TechTips #SystemMonitoring